Minimalist 2D Data-Viz
स्लाइड्स, वीडियो और इन्फोग्राफिक्सयहाँ जाता है: स्लाइड्स / इन्फोग्राफिक
A hyper-clean, flat vector style focusing on geometric clarity and mathematical precision rather than illustration. Best for quantitative reporting, market share breakdowns, and "by-the-numbers" executive summaries.
शेयर किया Mark Carver — Visual Style Guide for NotebookLM Presentations — असली हकदार को क्रेडिट।
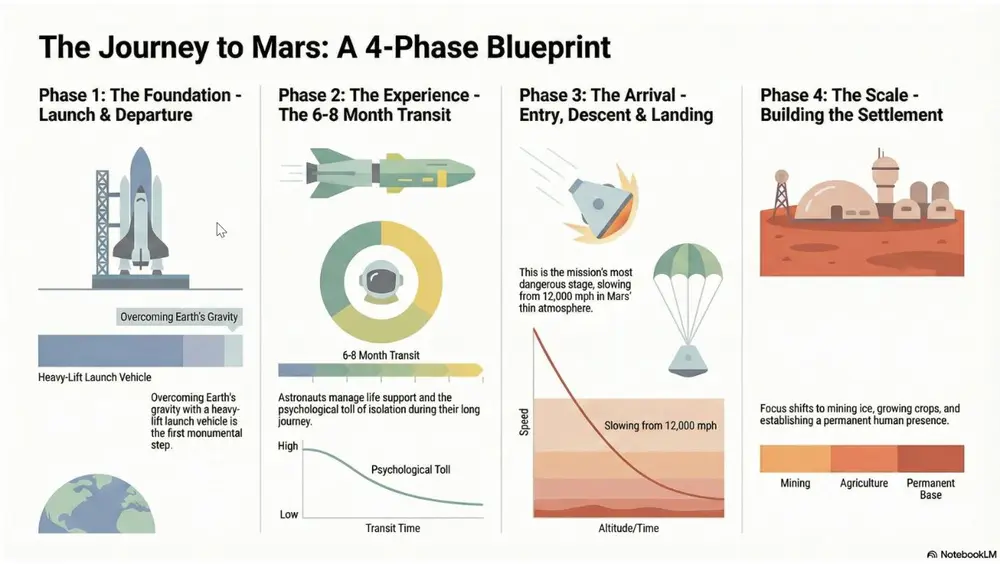
A minimalist 2D data-visualization style featuring flat vector bars, donut charts, and line graphs. Use a clean white background, perfectly aligned geometric shapes, and a sophisticated muted palette. Emphasize clarity and whitespace with zero gradients, no shadows, and professional sans-serif labeling.
इसे कैसे इस्तेमाल करें
- 1Studio पैनल में, स्लाइड्स या इन्फोग्राफिक चुनें और उसका प्रॉम्प्ट बॉक्स खोलें।
- 2स्टाइल स्पेसिफिकेशन पेस्ट करें।
- 3Generate करें, फिर अगर आउटपुट भटक जाए तो शब्दों में बदलाव करते रहें।
स्क्वेयर ब्रैकेट्स उन हिस्सों को दिखाते हैं जिन्हें आपको अपने टॉपिक या सवाल से बदलना है।
और स्लाइड्स, वीडियो और इन्फोग्राफिक्स प्रॉम्प्ट्स
- ChalkboardWhite "chalk" lines on a dark slate background with textured shading. Best for academic lectures, physics/math proofs, and historical retrospectives.
- WhiteboardA clean look resembling markers on a glossy whiteboard. Best for internal team briefings, "live" brainstorming sessions, and agile project updates.
- Sketch NotingHand-drawn icons and connectors with a classic "visual note-taking" feel. Best for executive summaries, workshop synthesis, and human-centric storytelling.
- Graphite & Charcoal RealismA fine-art style using monochromatic hand-drawn textures, cross- hatching, and realistic smudging. Best for high-stakes ethical discussions, historical reflections, or "Day in the Life" human-centric storytelling.